Y-DNA: New Tools from FamilyTreeDNA
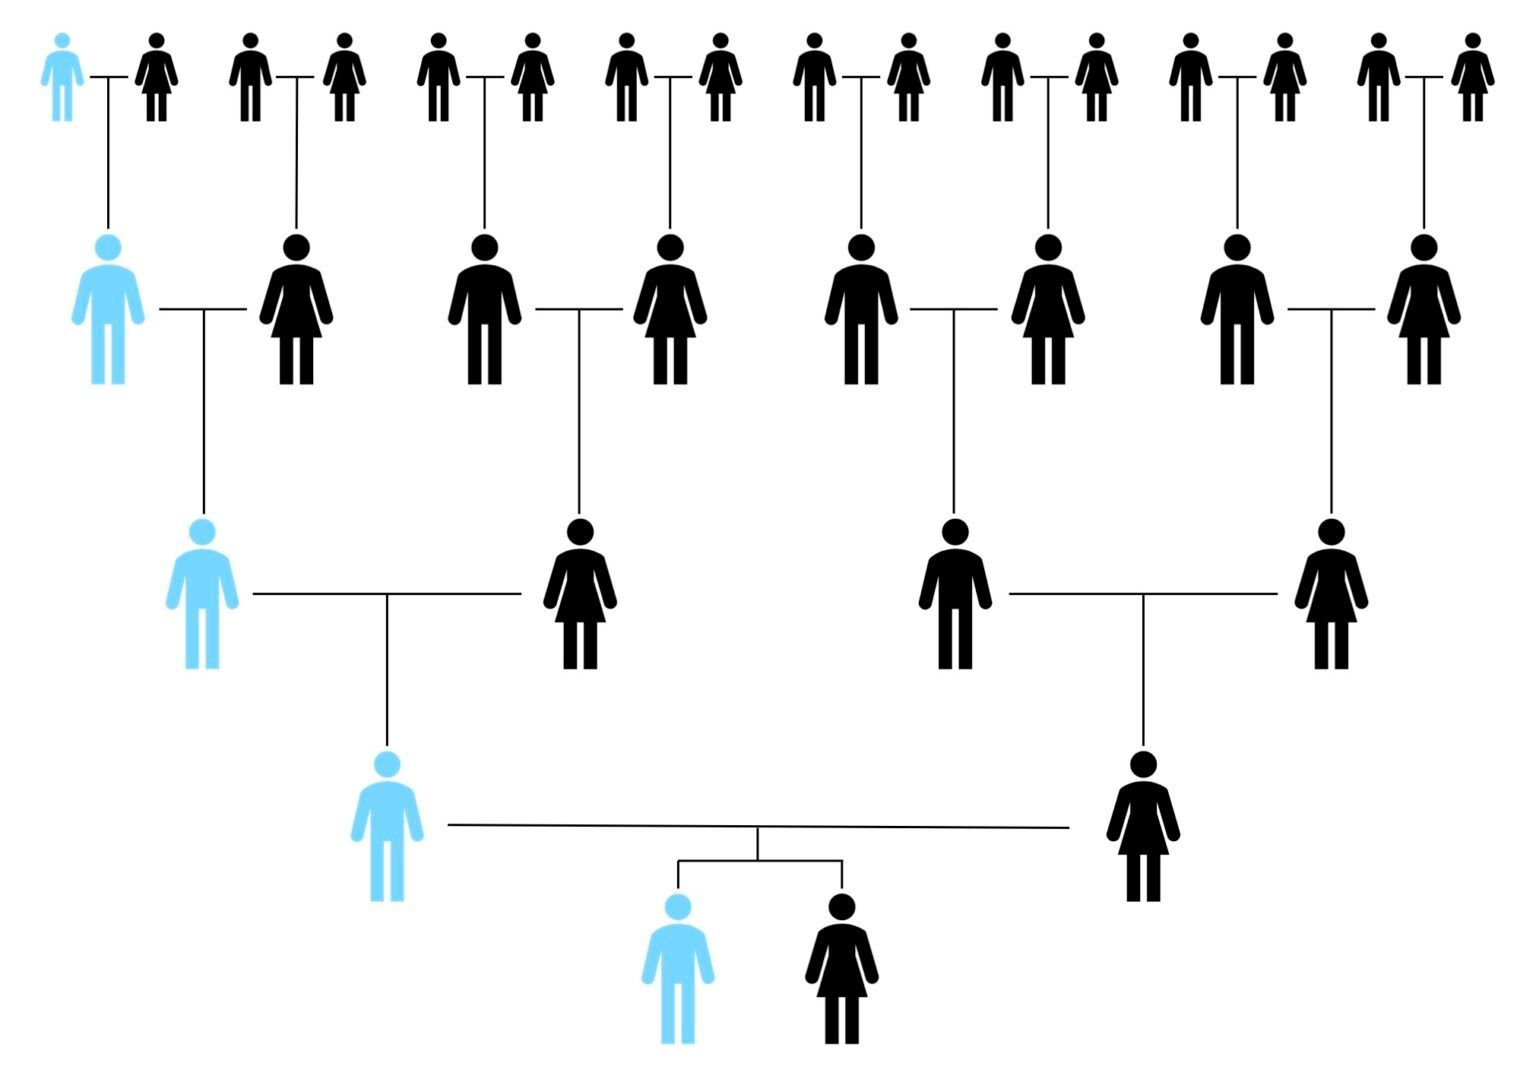
Family Tree DNA (FTDNA) have recently released some fantastic new tools which are of great use to those of us using Y-DNA. Y-DNA is not the DNA you test at Ancestry, My Heritage etc (that’s autosomal DNA), it is the DNA that is passed relatively unchanged down the male line for many generations (see diagram below).
Y-DNA is often used by those running surname studies as, in principle, the descent of the male line is the same as the descent of the surname. Y-DNA can therefore be used to assess the likelihood of all bearers of a particular surname arising from the same single individual, no matter how far back in time this individual lived. There are single surname DNA projects through the commercial testing sites and a number of One-Name Studies (ONS) also operate DNA projects. My Cowling One-Name Study is one such example.
To keep this post to a manageable length, the remainder of this post jumps straight into the technical detail. If you would rather read an introduction to Y-DNA testing, see my earlier blog post on the subject: Demystifying DNA: Y-DNA tests.
One of the objectives when using Y-DNA is to try and identify how far back the common ancestor of two individuals lived: the TMRCA or Time to Most Recent Common Ancestor.
STR Y-DNA tests: new Time Predictor (TiP) Reports
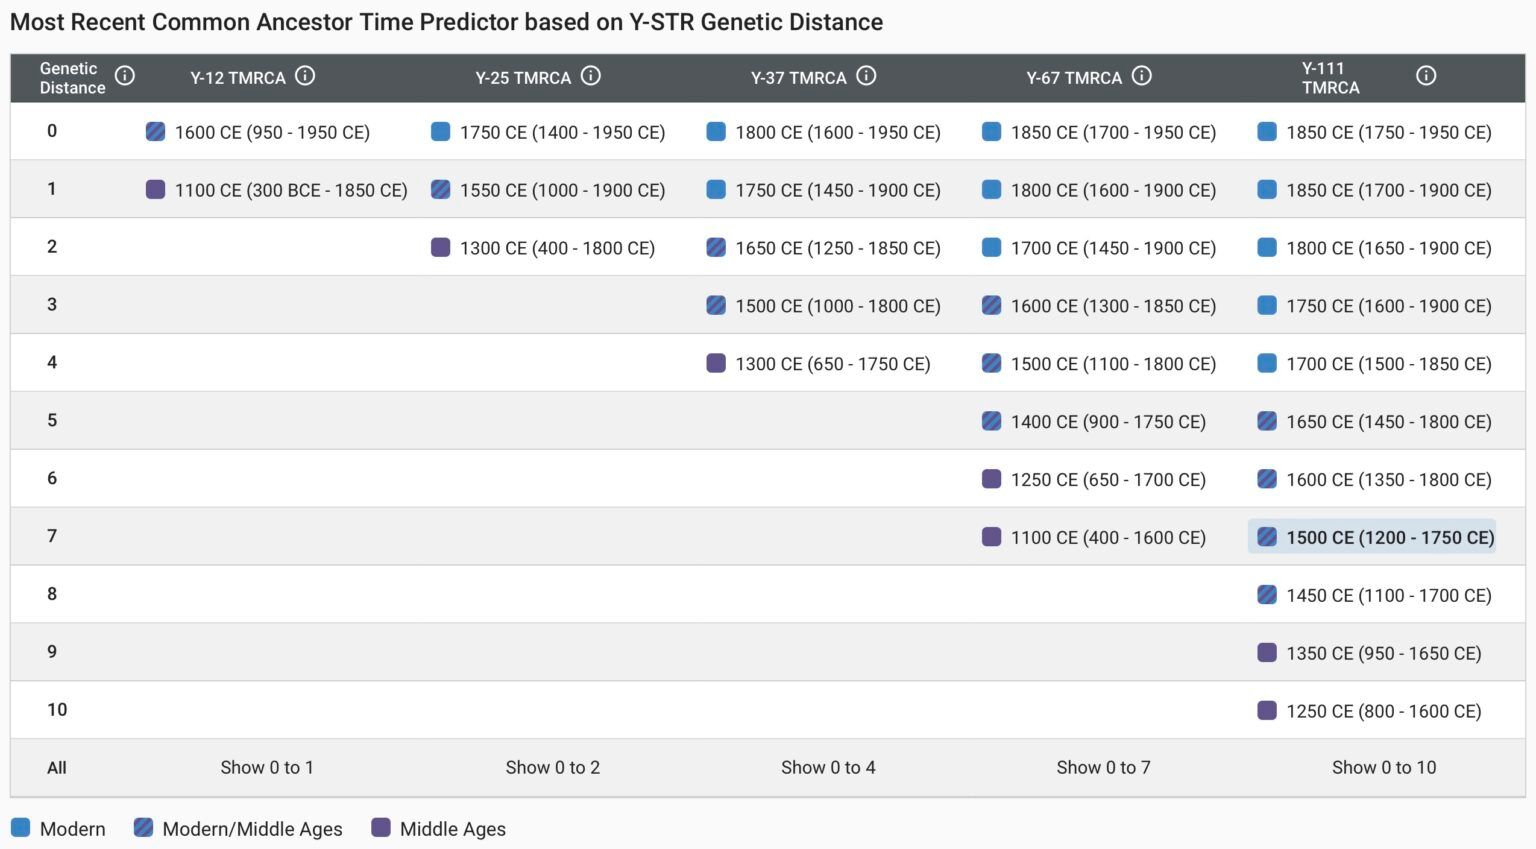
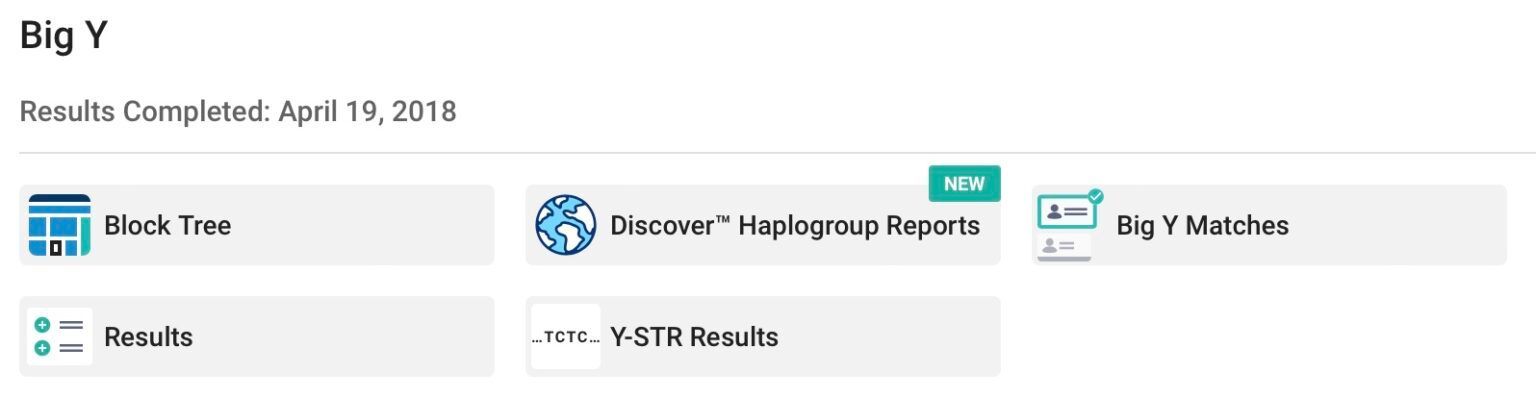
If you have taken an STR Y-DNA test, such as the Y-111 test, you probably have looked at the “Time Predictor” or “TiP” reports (accessed via the icon highlighted below) to get an estimate of how two individuals are related.

Until now, the Time Predictor report presented data in the form of a table of number of generations and confidence interval percentages. So it might be only 61% likely that two men were related by a common ancestor born up to 4 generations back, but 95% likely they were related via a common ancestor born within the last 12 generations. What did this mean? If we say a generation is 25-30 years, the common ancestor was 95% likely to have been born sometime between now and as far back as 1663. It wasn’t the most ideal way to view the data because it was easy to get fixated on that number of 12 generations and ignore the range.
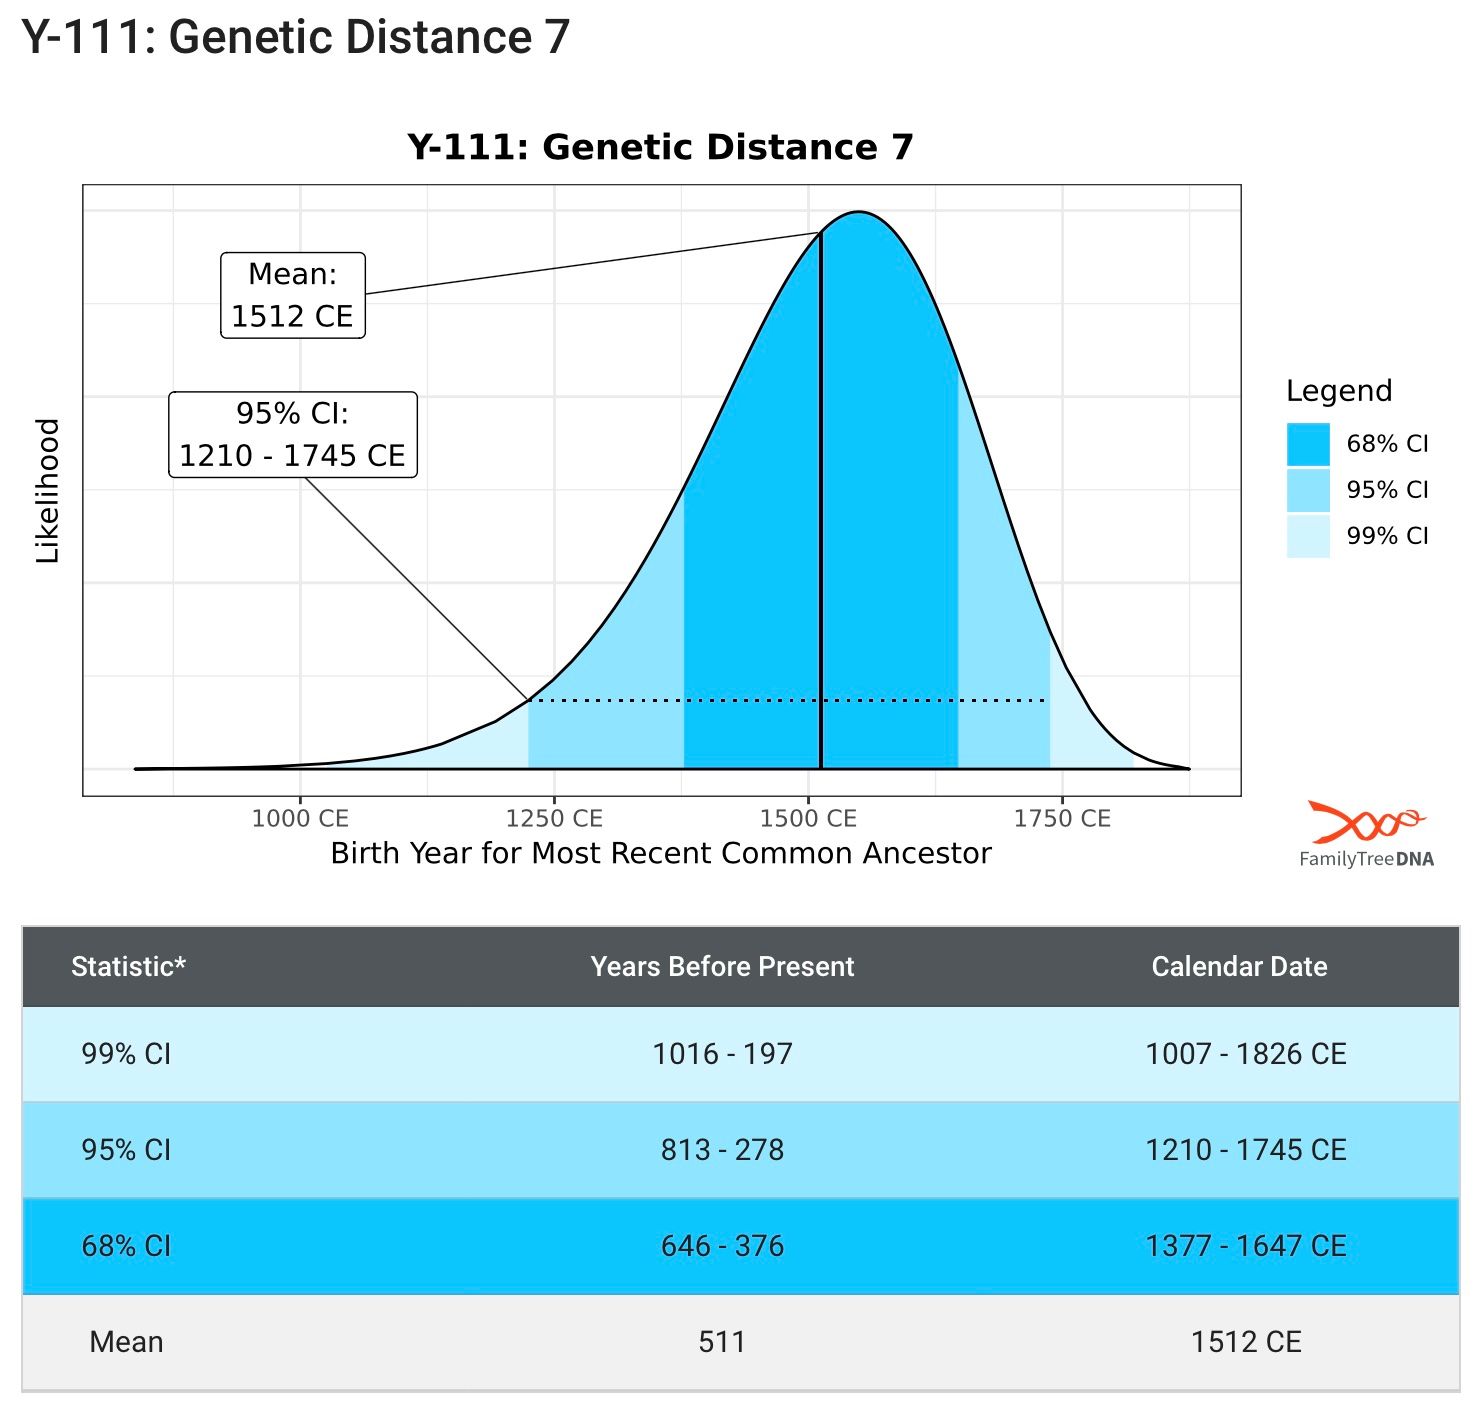
The Time Predictor functionality has had a complete revamp, both to the way in which data is now presented, making it far more user friendly, and to the algorithms used. The following example is of two of my Cowling project members, who match each other on their Y-111 tests with a genetic distance of 7. The match between them is highlighted in blue below:
We can see the common ancestor is likely to have been born around the year 1500, but there is a significant range, and this much more clear in these new reports. The common ancestor for this pair of testers could have been born anywhere between around 1200 and 1750. At the bottom of the report you will find wording to clarify this which tells us the two “are estimated to share a common paternal line ancestor who was, with a 95% probability, born between 1200 and 1750 CE. The most likely year is rounded to 1500 CE”. If you click on the area highlighted in blue above you can see the same information presented in a slight different way:
We can also see the affect that increasing genetic distance has on the estimates by clicking in the grey bottom section of the MRCA table (where you have “Show 0 to 10” etc):
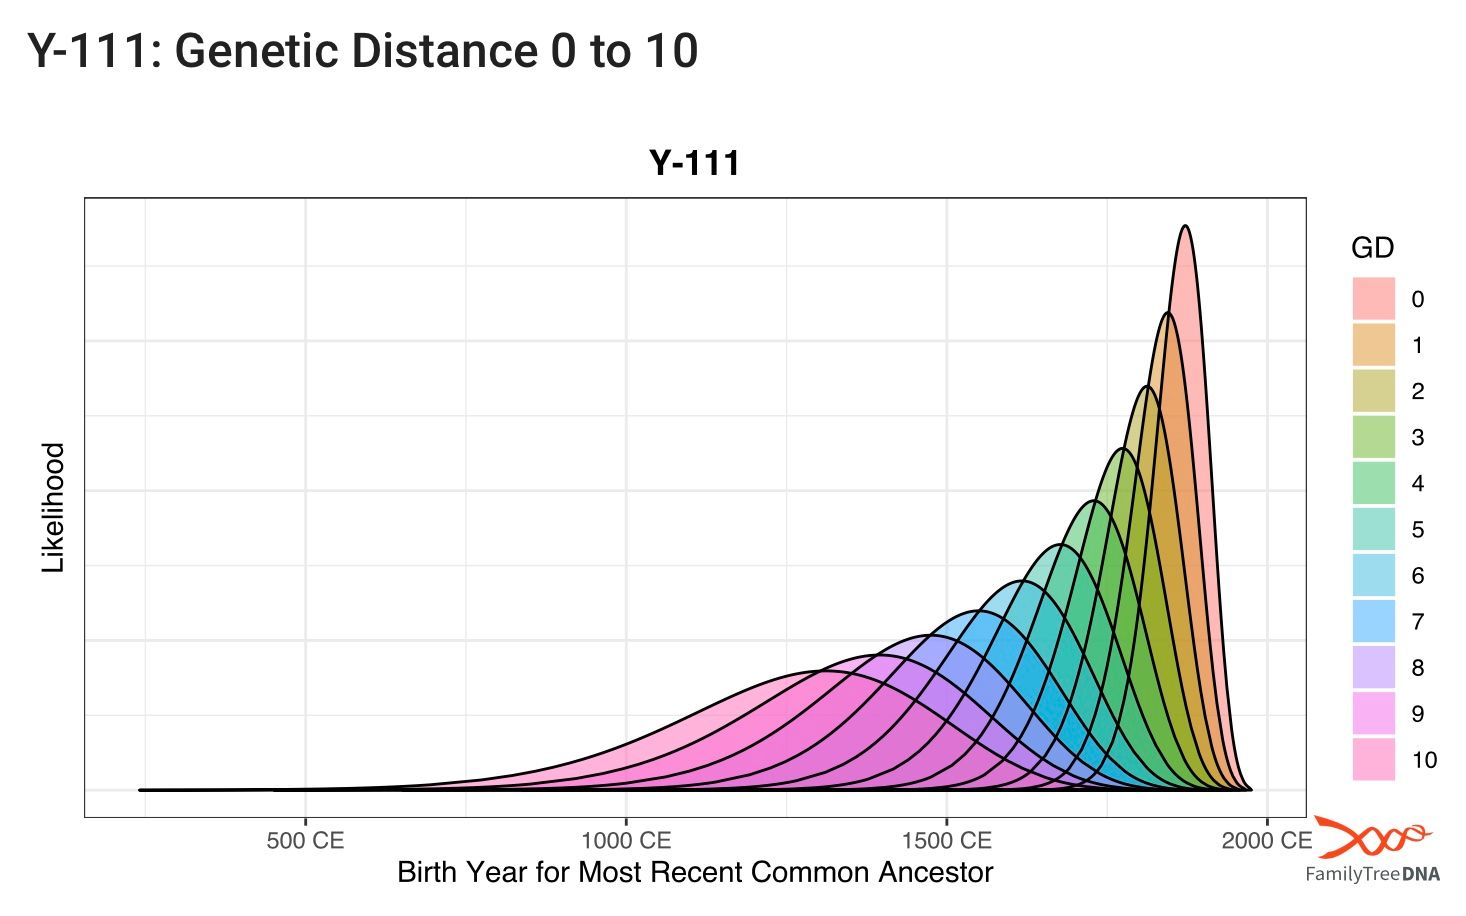
It is clear to see that the greater the genetic distance the greater the range becomes and why, at higher genetic distances, the chance of finding a common ancestor within a genealogical relevant time frame (i.e. where documentary evidence exists) becomes less likely.
The previous TiP report was based on STR mutation rates and included a consideration of known different mutation rates of different STRs. So, depending on where you and an individual differed on the Y-DNA molecule, you might see two different MRCA estimates for two different matches that had both taken the same type of Y-DNA test and were the same genetic distance from you.
The new TiP report as shown above is the same for everyone, and is based on a huge amount of real data from those who have taken the Big-Y test, using Family Tree DNA’s new Age Estimates. In their words: “The millions of slow-mutating Y-SNP markers tested by Big Y together with the faster-mutating but fewer Y-STR markers give state-of-the-art estimates for the Time to Most Recent Common Ancestor (TMRCA) of each branch on the Y-DNA haplotree”. FTDNA then used this data to model most likely TMRCA ranges for each combination of number of Y-STR markers tested and genetic distance. Whilst the data is much improved it also corrects the reported error from users that the old predictions were too optimistic, i.e. they suggested a common ancestor in a more recent timeframe than the reality. So, try not to be disappointed if the new and improved data makes it look like your match is related further back in time than you originally thought!
You can read more about the new TiP reports here: Introducing the New FTDNATiP™ Report for Y-STRs.
Big Y DNA tests: Time Trees and Group Time Trees
The most detailed type of Y-DNA from Family Tree DNA is the Big-Y 700 test. Those who have taken this test are now able get a better estimate of how recently fellow Big-Y testers connect. We have had the “Block Tree” for a while, and we could estimate a TMRCA by counting the number of SNPs back to the common haplogroup. There were various estimates for this but there was a consensus that, for Big Y-700 data, an assumption of 83 years per SNP was suitable.
The Time Tree was released towards the end of last year, and uses the Age Estimates mentioned above to predict when a haplogroup was formed, i.e. when the MRCA was born. You can access this from the “Discover Haplogroup Reports” area of your Big Y dashboard, where your haplogroup, as calculated from your Big-Y test will be filled in for you.
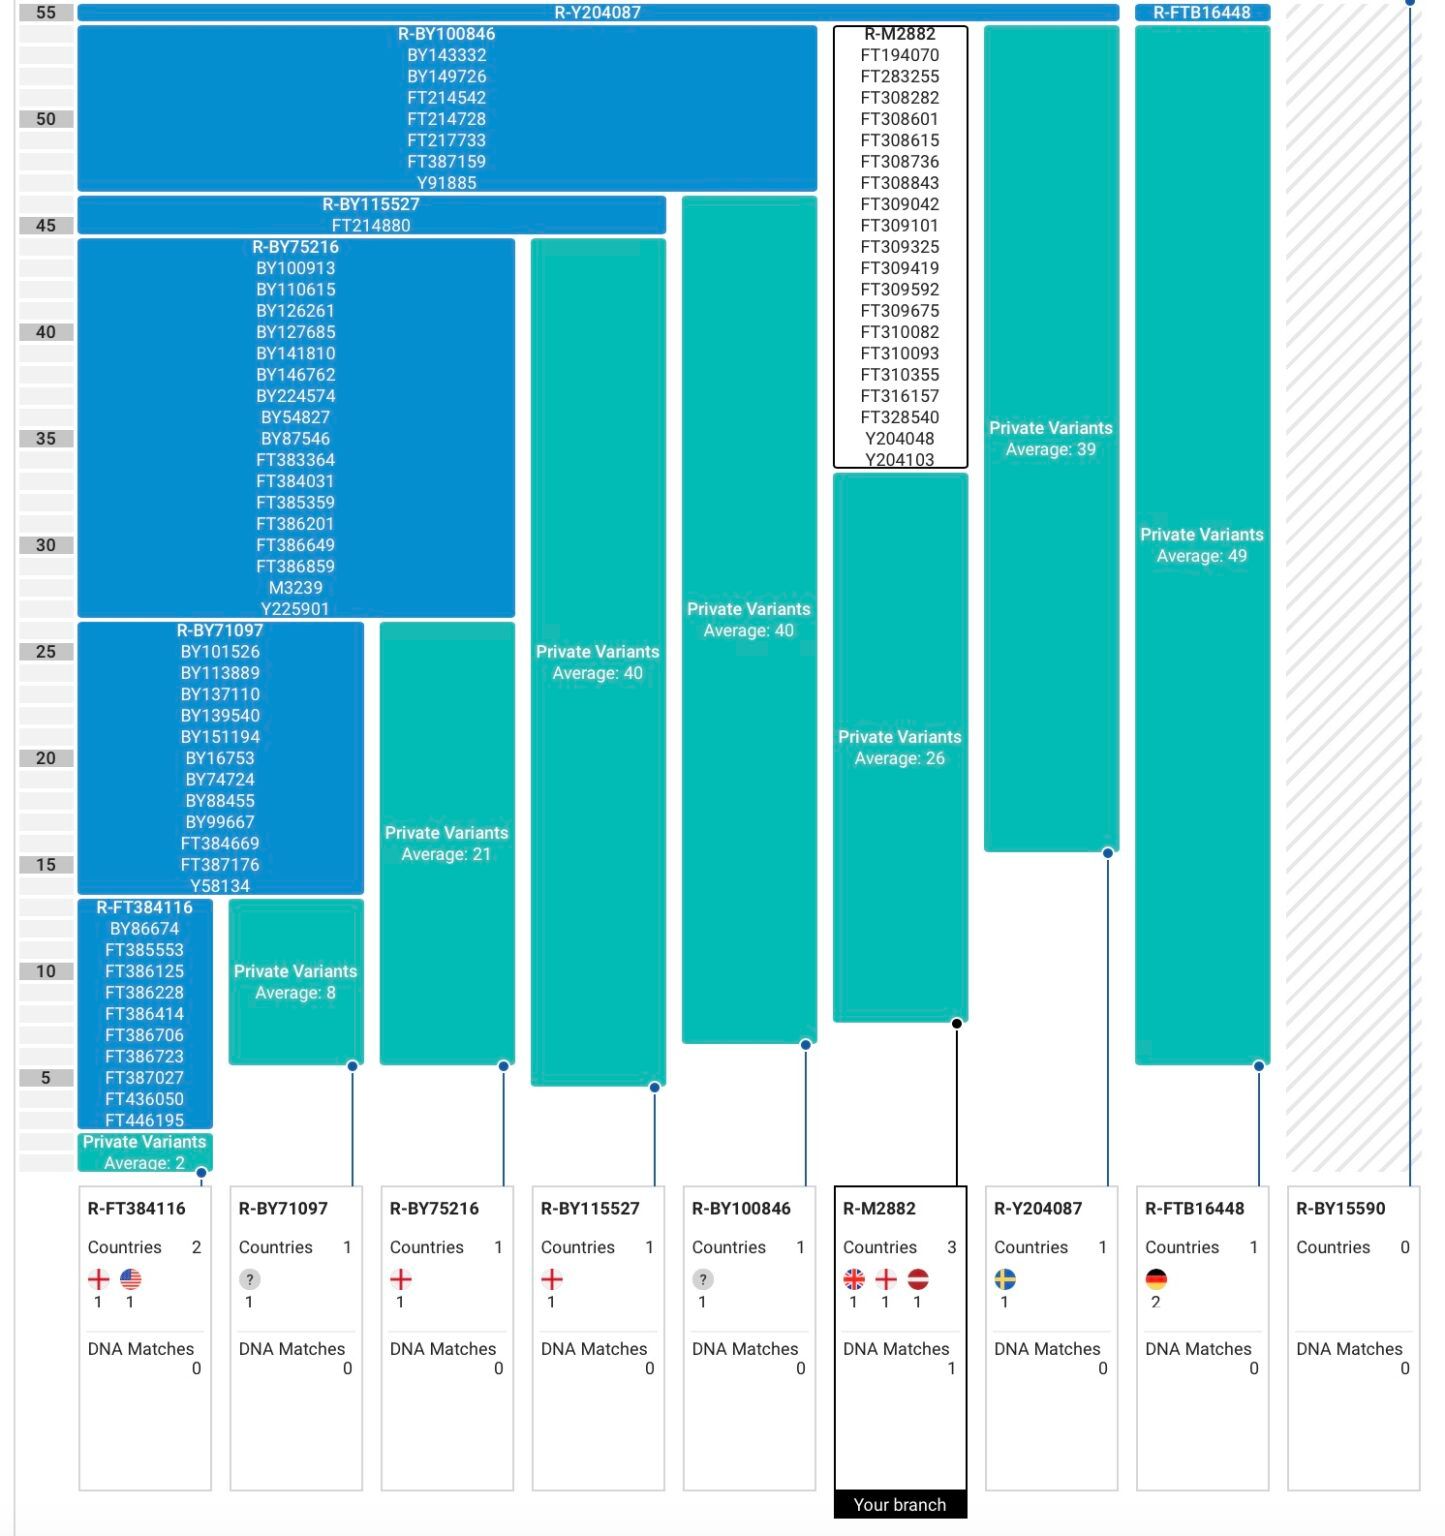
A cut down example for haplogroup R-M2882 is shown below, which shows the MRCA for this individual’s haplogroup was likely born in around 900 BCE. Hmm, probably before the start of genealogical records then!
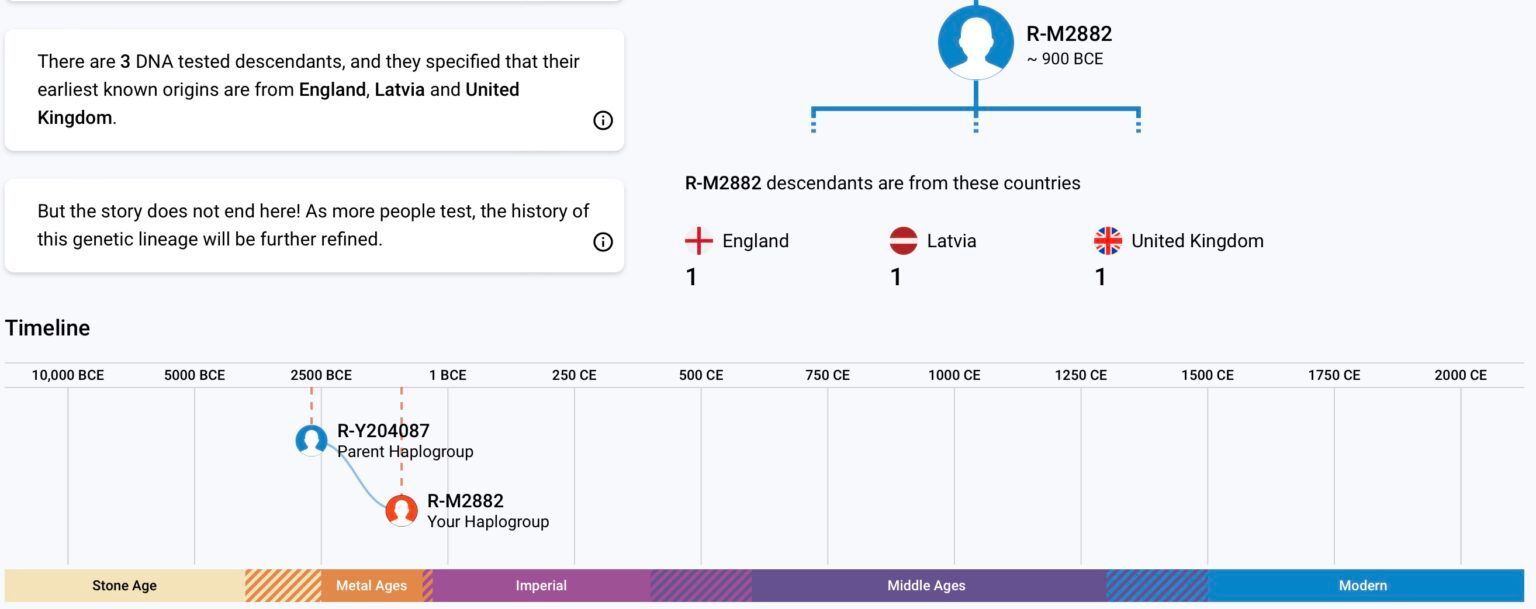
You can see there are three testers in the database with this haplogroup , two from the UK and one from Latvia. This is all very interesting but the latest release is even more exciting. Now we can look at all members of a FTDNA project together in Group Time Trees. There are different types of DNA projects: in my research I am most interested in a surname project but there are also projects based on places and haplogroups. You can see the diagram for my Cowling surname DNA project below:
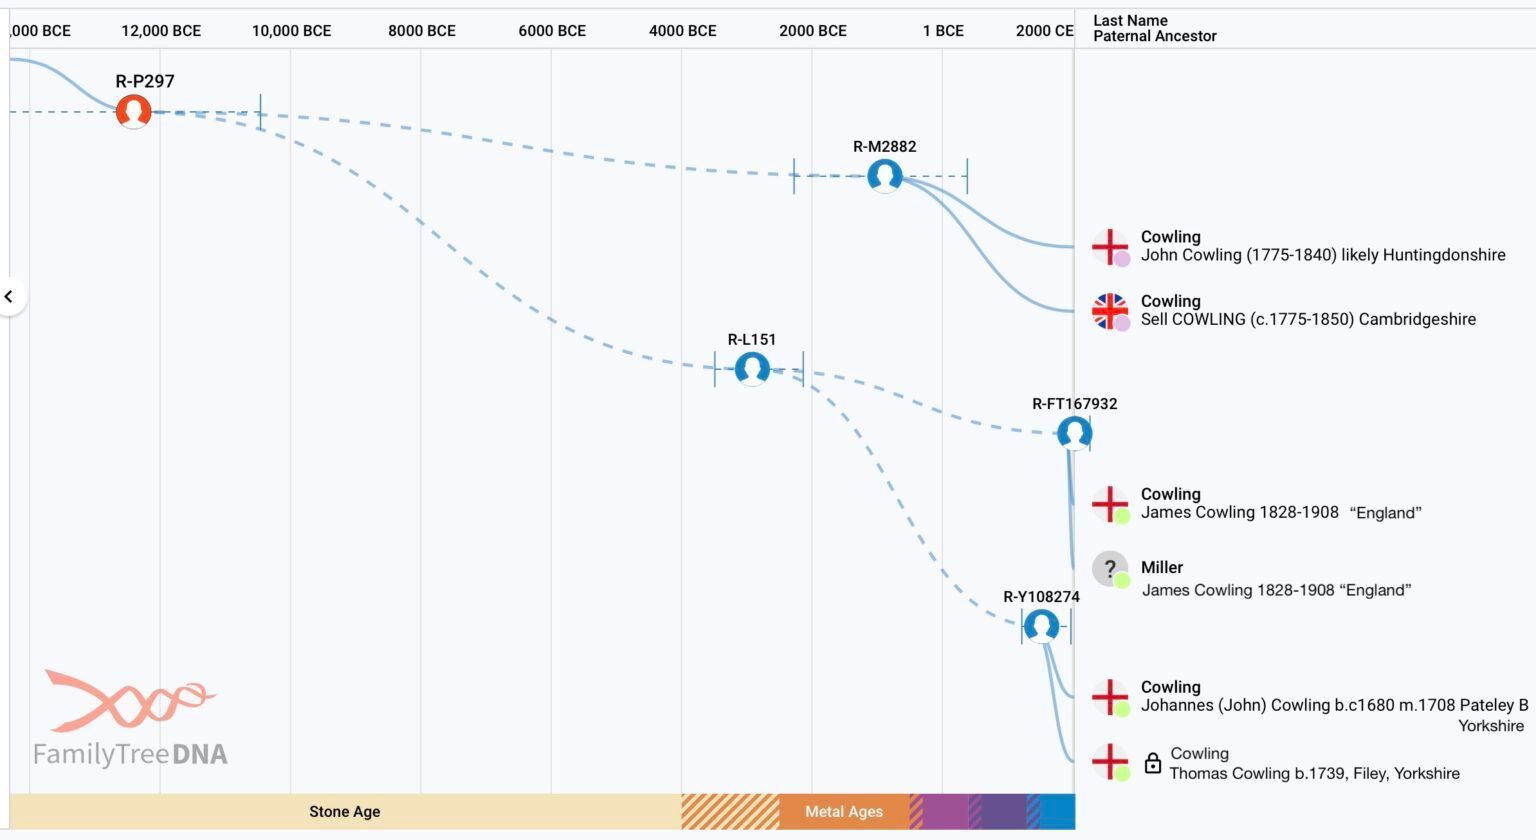
Note that the R-M2882 group is included here and we can see that those two UK testers are members of my Cowling surname project, originating from Cambridgeshire and Huntingdonshire (neighbouring counties) based on research to date. There is also a pair of Yorkshire Cowlings with a more recent haplogroup, formed in around 1384 CE (range c.950-c.1700). The Cowling and Miller individuals are known close paternal relatives, so it is not surprising their haplogroup was formed more recently, in around 1900 CE, with a range from c.1750-c.1970. What does this mean for the Cowling project? We need more Y-DNA Big Y testers! The more people that test, the more new SNPs can be identified and the more haplogroups or branches can be added to the Y-DNA haplotree.
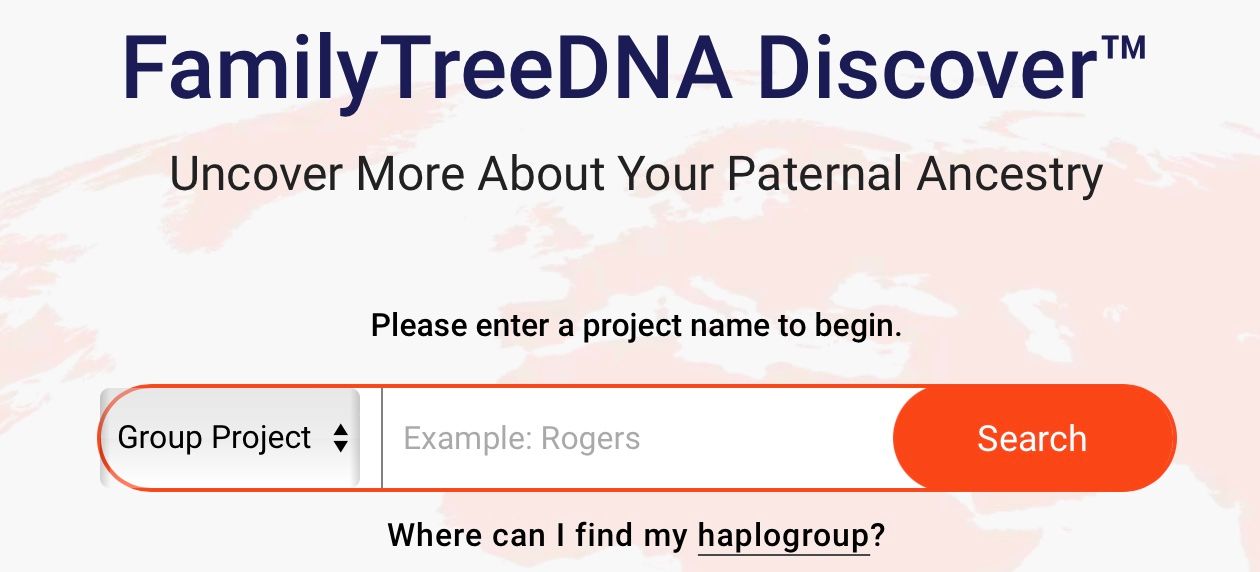
You can access the Group Time Tree for any project at the FamilyTreeDNA Discover page, but be sure to select “group project” to the left of the search box:
For more information about the Group Time Tree, see here: The Group Time Tree: A New Big Y Tool for FamilyTreeDNA Group Projects.
A plea from me
You can only see data in the Group Time Tree for individuals that have opted into sharing within a project. If you are a member of a project, please switch on sharing in the FamilyTreeDNA Account Settings to benefit others, using:
Group Projects -> Manage Group Projects -> Project Preferences -> Opt in to Sharing:

Lastly, if you are a COWLING and would be interested in joining the Cowling DNA project please get in touch via the Cowling DNA Project page.